search faculty.ai
Search for:
Shape
Created with Sketch.
close
Frontier
Frontier
Frontier for Healthcare
Frontier for Operations
Services
Applied AI Services
Applied AI
Generative AI Roadmap
AI Services by Industry
Defence
Energy Transition & Environment
Government & Public Services
Life Sciences
Consumer & Services
Fellowship
Become a data scientist
Hire AI Talent
Resources
Case Studies
CASE STUDIES
Frontier
Health & Life Sciences
Retail & Consumer
Government & Public Services
Energy Transition & Environment
Financial Services
Blog
Webinars
Events
AI Ethics & Safety
Newsroom
Research
Open source
Company
About us
Partnerships
Partnerships
Our partners
Accenture
Microsoft
AWS
OpenAI
Verian
Join the team
Contact us
Contact us
BLOG
Blog
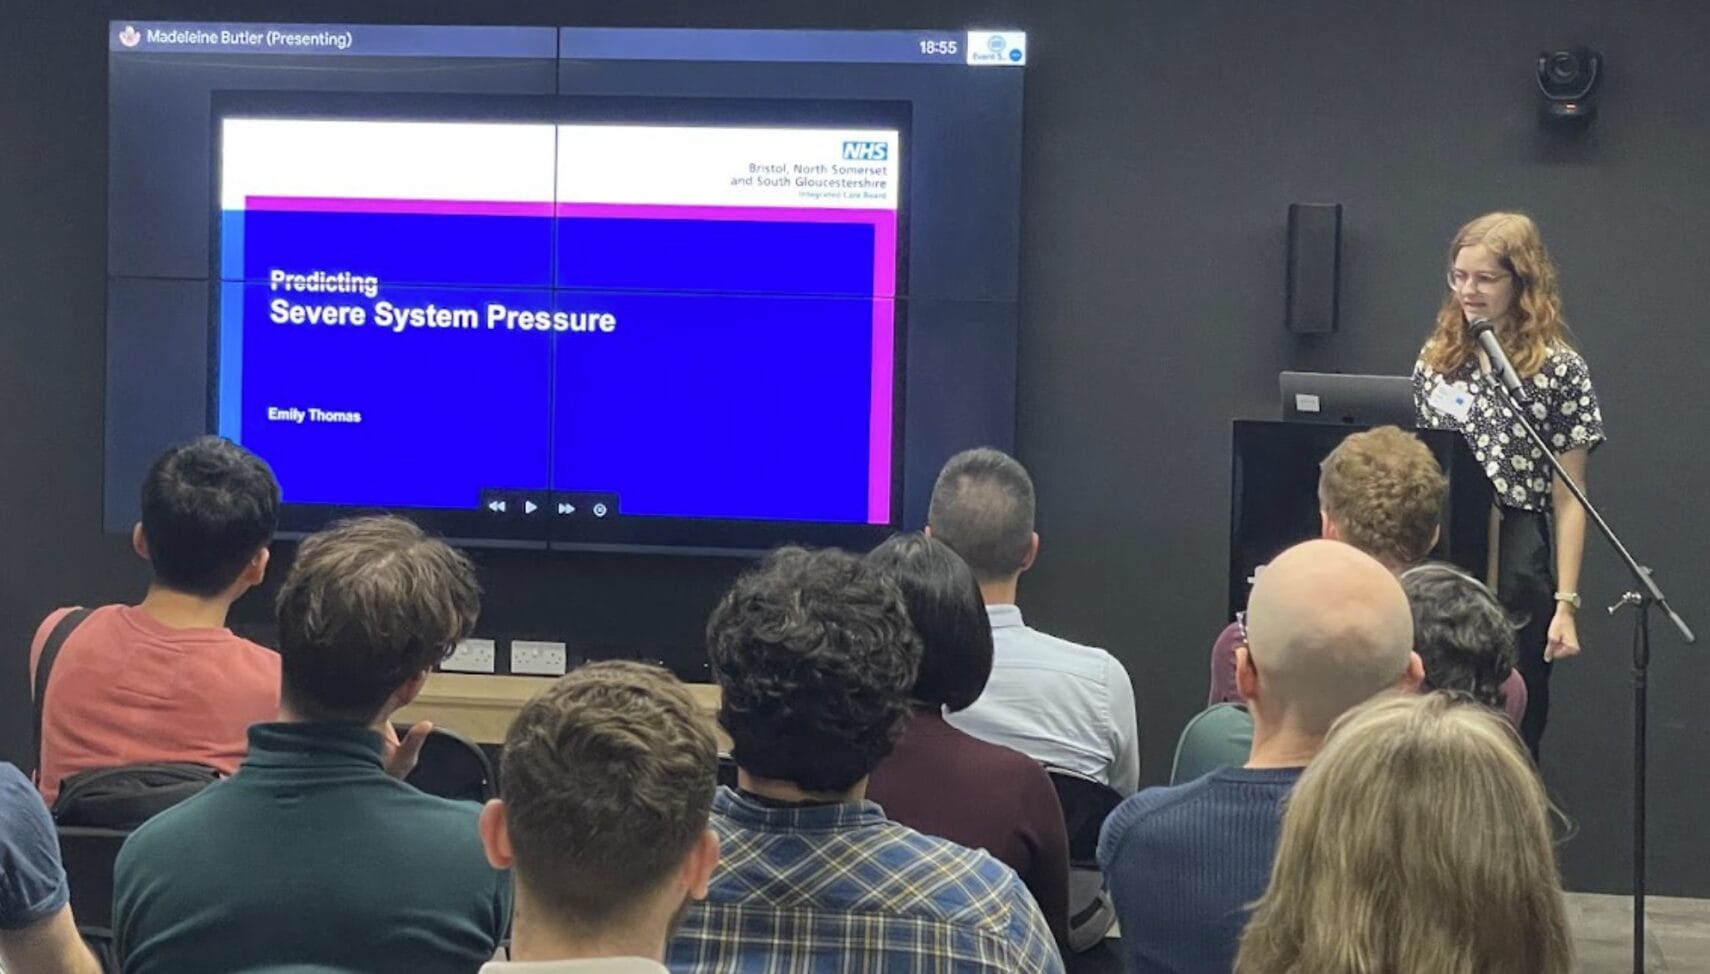
Using AI to predict severe system pressure up to 10 days in advance
12 Apr 2024
Blog
Meet the team: Andrew Perry
11 Apr 2024
Blog
Creating an AI Enabled Organisation
27 Mar 2024
Blog
Artificial Intelligence: can it be regulated?
John Gibson
27 Mar 2024
Blog
Ensuring end-to-end safety in Generative AI: a comprehensive approach
Jake Luscombe
07 Mar 2024
Blog
Presenting the opportunities of operational AI to Life Sciences Hub Wales
06 Mar 2024
Blog
Generative AI: how to cut through the noise and identify where it can make the biggest impact
Ben Bedford
15 Feb 2024
Blog
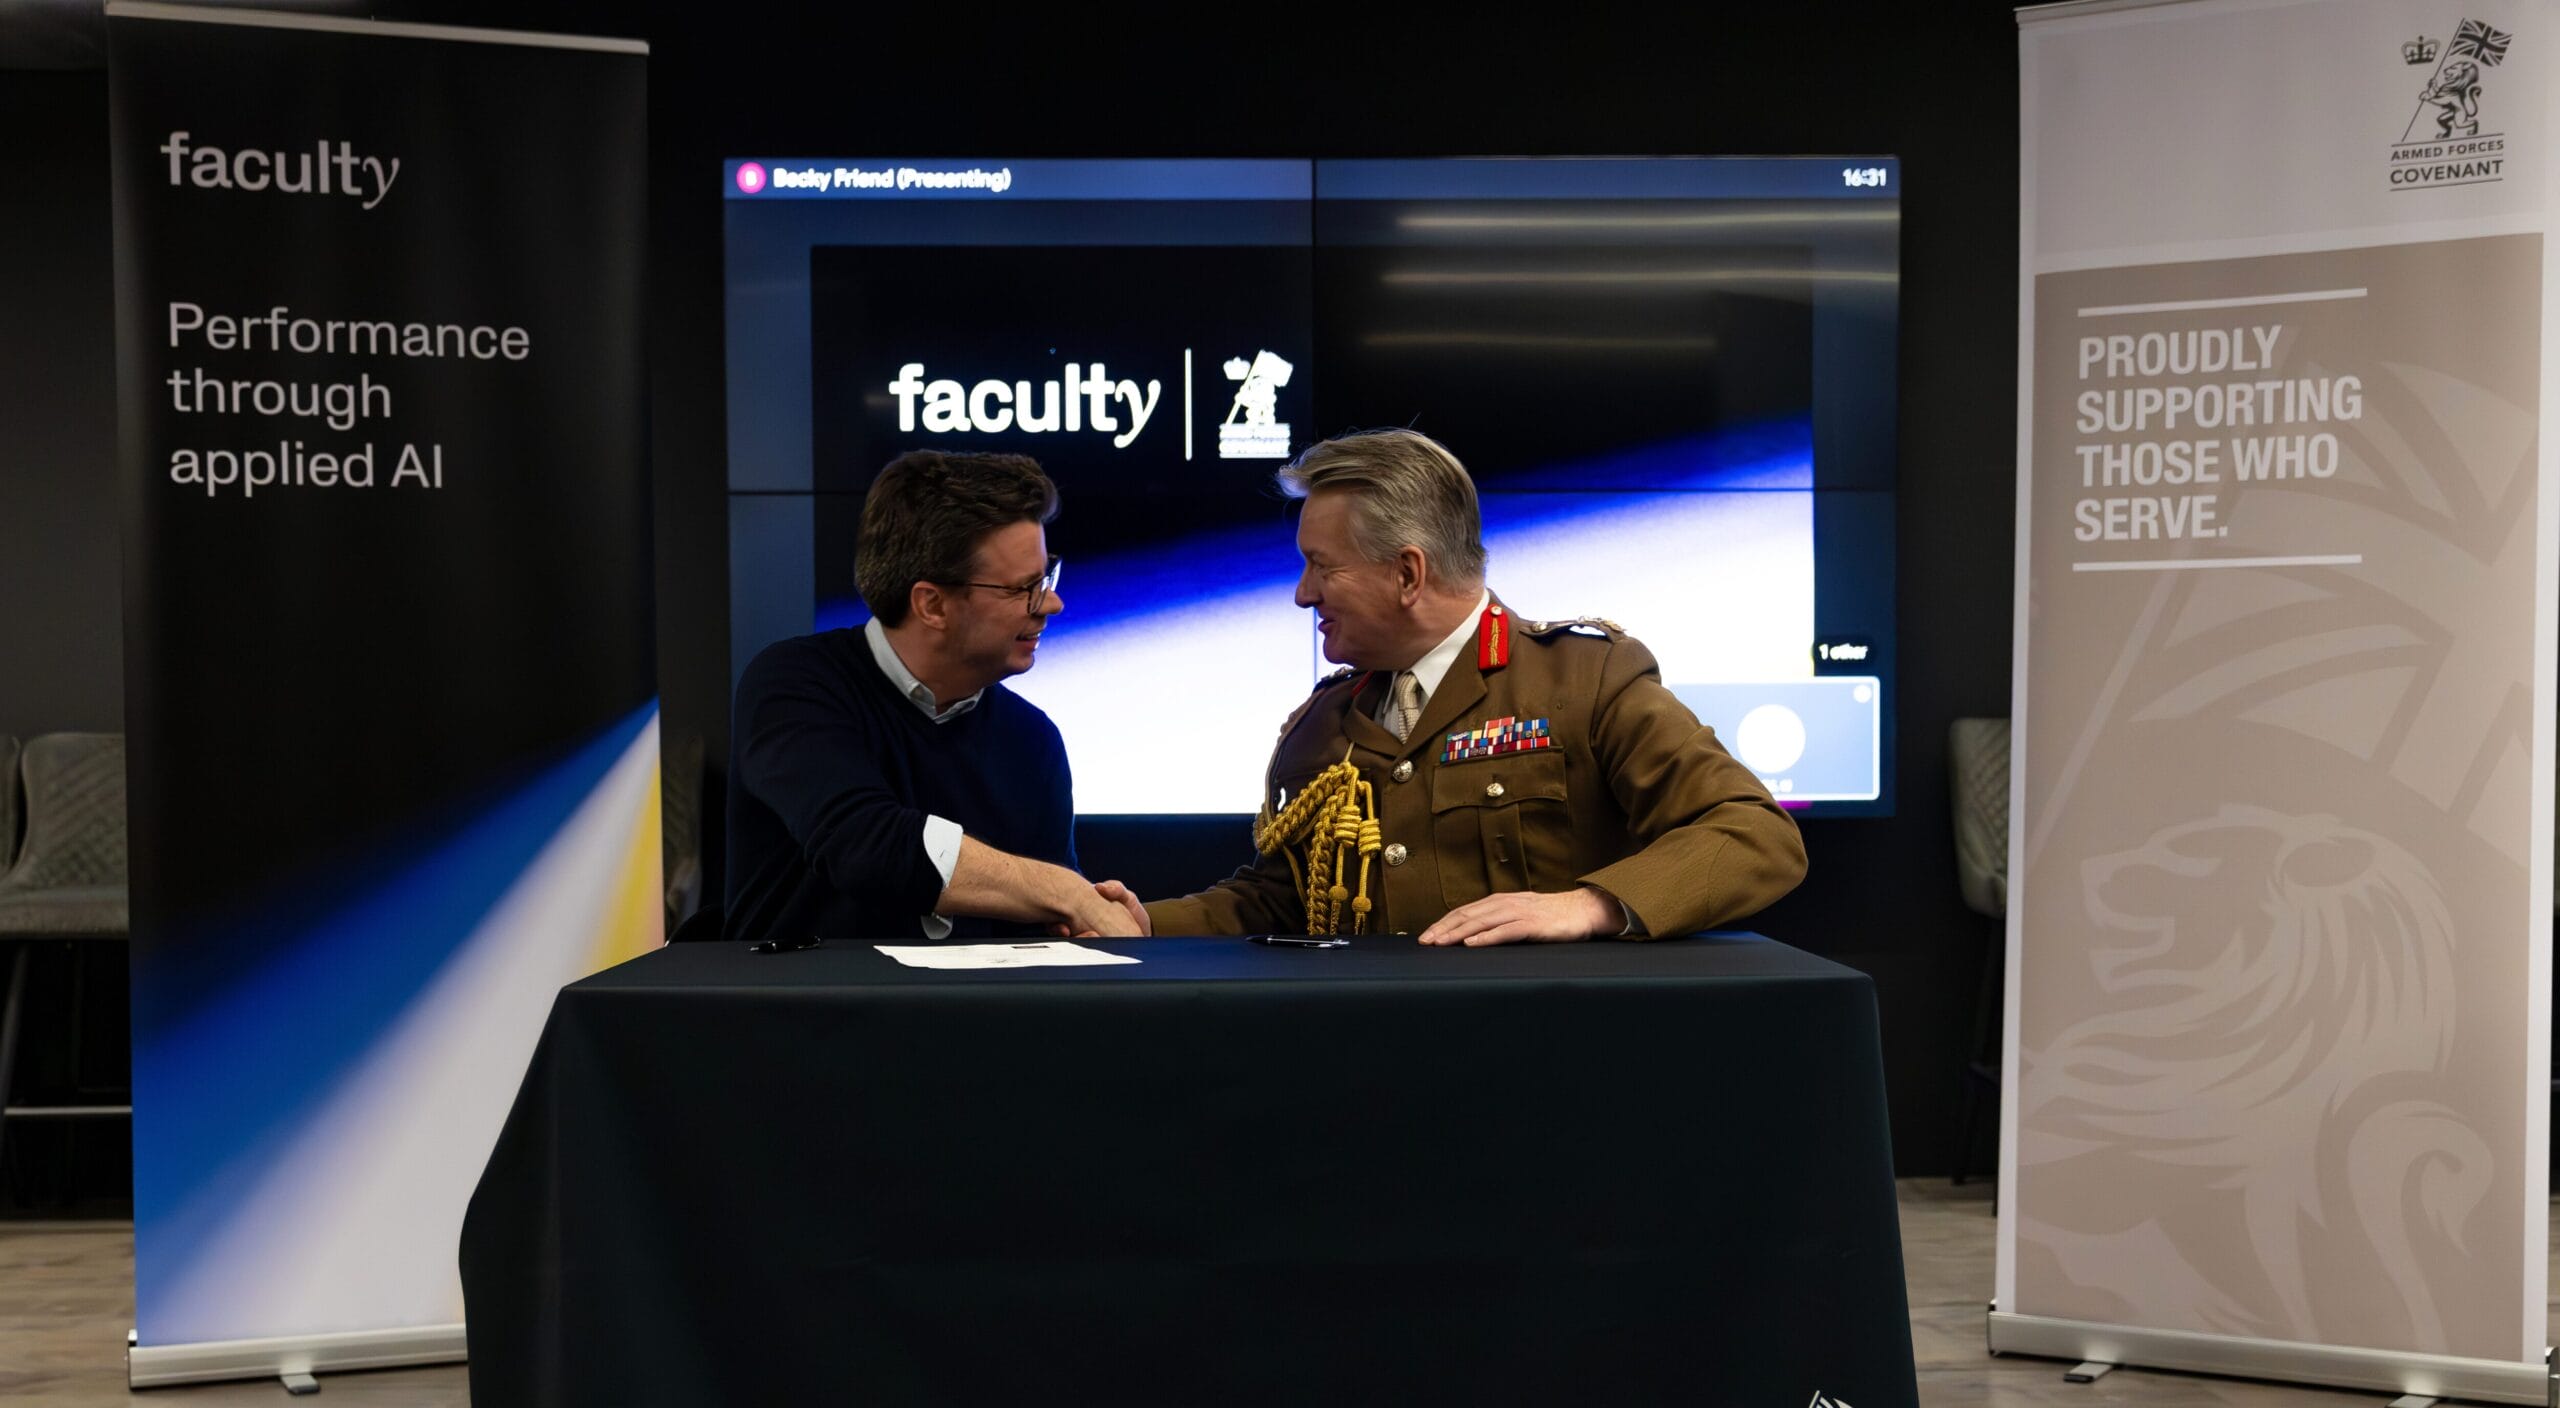
Faculty stands together with military veterans: sealing its pledge with the Armed Forces Covenant
12 Feb 2024
Blog
Building generative AI-powered public services: what have we learned so far?
Paul Maltby
08 Feb 2024
Blog
Generative AI: where are we now and where are we heading?
Louis Claxton
01 Feb 2024
Load more
Frontier
Frontier
Frontier for Healthcare
Frontier for Operations
Services
Applied AI Services
Applied AI
Generative AI Roadmap
AI Services by Industry
Defence
Energy Transition & Environment
Government & Public Services
Life Sciences
Consumer & Services
Fellowship
Become a data scientist
Hire AI Talent
Resources
Case Studies
CASE STUDIES
Frontier
Health & Life Sciences
Retail & Consumer
Government & Public Services
Energy Transition & Environment
Financial Services
Blog
Webinars
Events
AI Ethics & Safety
Newsroom
Research
Open source
Company
About us
Partnerships
Partnerships
Our partners
Accenture
Microsoft
AWS
OpenAI
Verian
Join the team
Contact us
Contact us
Search
Close